This post is also available in:
 Français (French)
  Español (Spanish)
The airline network page provides a lot of information to best manage your routes and hubs. It contains a map of your airline network. AM+ members can see their aircraft fly in real time on this map!
List of hubs
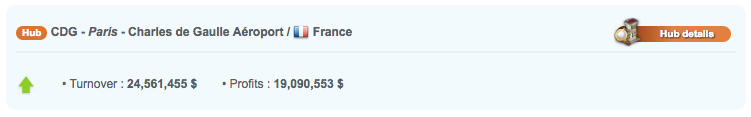
This list shows the essential information about your different hubs:
- Hub: name of the hub (if you are a beginner, you only have one hub)
- Performance: the performance index of the hub enables to know the evolution of its profits. If your profits on D-1 are better than those on D-2, the arrow is green and goes upward; if your profits remain stable, the arrow is orange and goes to the right; if your profits decrease, the arrow is red and goes downward. This index is very useful to check the evolution of your hub caused by the recent changes made by your airline.
- Turnover: the turnover (T/O) generated by this hub.
- Profits: the profit generated by all routes departing from this hub.
- Hub details: this button enables you to view all the details of the hub (see below).
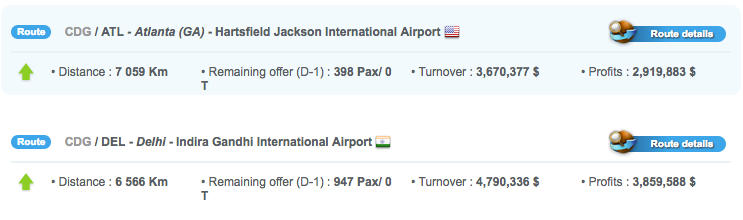
List of routes
Like the hubs list, the routes list enables you to view the most important information about them:
- Route: name of the route represented by the IATA code of the departure hub and the arrival airport.
- Performance: the performance index of a route enables you to view the evolution of its profits. If your profits on D-1 are better than those on D-2, the arrow is green and goes upward; if your profits remain stable, the arrow is orange and goes to the right; if your profits decrease, the arrow is red and goes downward. This index is very useful to check the evolution of your hub caused by the recent changes made by your airline.
- Distance: distance of the route for a one-way flight, it is the distance to take into account before purchasing an aircraft to compare the route distance with the aircraft range.
- Remaining offer: number of passengers who want to travel on this route with your airline and for whom you don’t offer seats in any flight. This figure is an addition of the different passenger classes. If you only want to make one passenger class travel, it is recommended to increase prices for the other classes until their demand falls to 0 and therefore facilitate the reading of the remaining offer.
- Turnover: the turnover generated by this route. This is the gross result of the route before deducting the different operating costs.
- Profits: the net profit generated by all the aircraft flying on this route.
- Route details: this button enables you to view all the details about this route (see below).
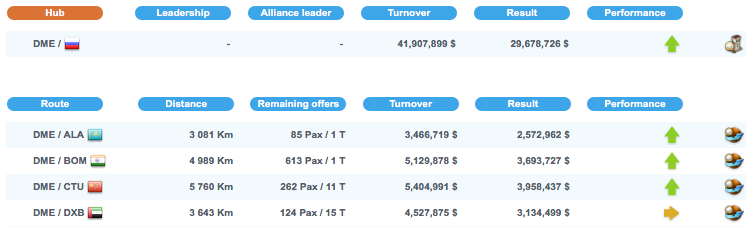
Pro display
The pro display is an AM+ option that enables you to display the list of your hubs and routes in table format. See below an example of pro display:
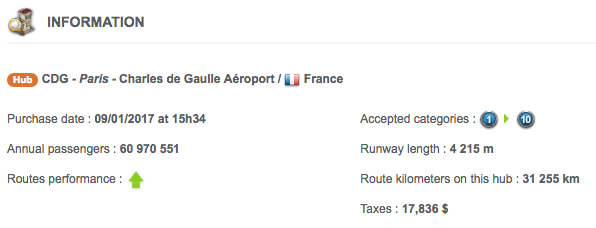
Hub details
The hub details page provides two informational inserts with further details about the hub:
- Hub: name of the hub.
- Purchase date: date at which you purchased the hub.
- Annual passengers: number of passengers traveling via this hub in reality.
- Route performance: the performance index of the hub enables you to view the evolution of its profits. If your profits on D-1 are better than those on D-2, the arrow is green and goes upward; if your profits remain stable, the arrow is orange and goes to the right; if your profits decrease, the arrow is red and goes downward. This index is very useful to check the evolution of your hub caused by the recent changes made by your airline.
- Accepted categories: the aircraft categories accepted by this hub. An aircraft out of these categories cannot fly from or to the hub so be careful when you purchase your aircraft.
- Runway length: maximal length of the longest runway that enables aircraft to take off and land, the category is determined according to this length.
- Km of routes on this hub: number of route kilometers you own for this hub.
- Taxes: amount of current taxes on all flights of the hub.
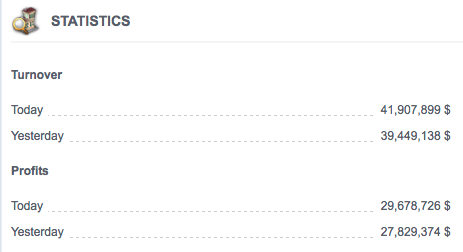
The second insert shows the detailed results of the hub:
- Turnover: the turnover generated by this hub. It is possible to compare this figure with the figure of the day before.
- Profits: the actual profits of this hub. You can compare this figure with the figure of the day before.
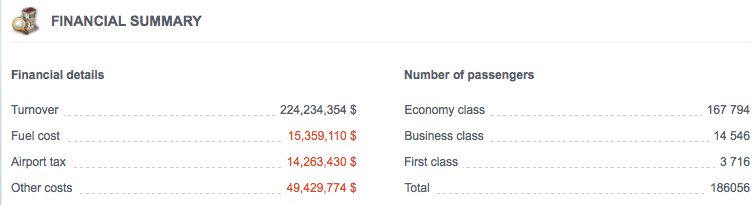
The third insert is the financial summary of the hub:
- Financial details: turnover, fuel cost, airport tax, other costs (flights cost: on-board catering, cleaning, etc.).
- Number of passengers: economy class, business class, first class, total.
Route details
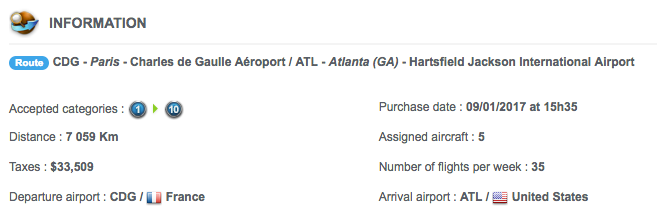
This page shows five inserts containing all the information you may need to manage your routes in an optimal way:
- Accepted categories: the aircraft categories accepted by this route, no aircraft excluded from these categories can serve this airport. Keep that in mind when you purchase your aircraft.
- Distance: distance of the route for a one-way flight. This is the distance you have to take into account before purchasing your aircraft in order to compare the route’s distance with the aircraft’s range.
- Taxes: amount of taxes paid for the route.
- Departure airport: the departure hub of the route.
- Purchase date: date and hour at which you purchased the route.
- Assigned aircraft: number of aircraft assigned to the route.
- Number of flights per week
- Arrival airport: IATA code of the arrival departure and destination country.
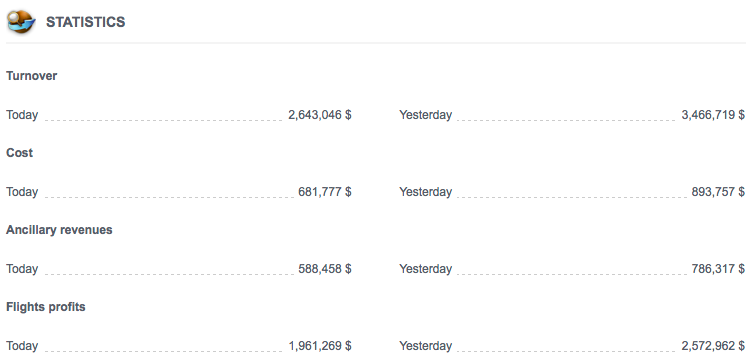
The second insert shows the detailed results of the route:
- Turnover: the turnover generated by this route, you can compare this figure with the figure of the day before.
- Cost: costs related to operating flights on this route, it is possible to reduce these costs by changing the “expenses” airline characteristic.
- Ancillary revenue: expenses of your customers when excluding ticket prices. It is possible to increase your ancillary revenue by changing the “Ancillary revenue” airline characteristic.
- Flights profits: the actual profits generated by the route’s flights, you can compare this figure with the figure of the day before.
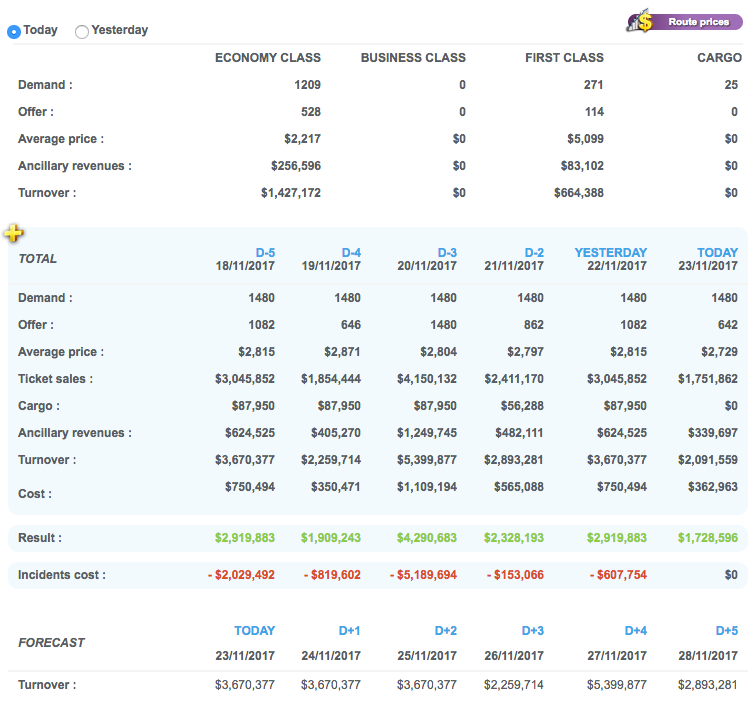
The third insert shows the demand and the prices of this route for each passenger class:
- Demand: the total number of passengers who want to travel on this route with your airline. You can make this total fluctuate by changing your prices and some airline characteristics.
- Offer: the number of available seats in the aircraft scheduled for this route. It is the maximum number of passengers you can carry on this route with the aircraft you have already scheduled.
- Average price: price paid by each passenger traveling on this route with your airline.
- Ticket sales (AM+): earnings from sales of commercial flight tickets.
- Cargo (AM+): earnings from sales of cargo tonnes.
- Ancillary revenue: it represents the expenses of your customers – when excluding ticket prices – that increase your airline’s balance.
- Turnover: total gross amount of earnings before deducting expenses.
- Cost (AM+): expenses and on-board services.
- AM+ forecast: AM+ members can view these figures from today to D-5.
- Route prices button: enables you to directly access the prices change section of this route.
- Accounting details button: enables you to access the details of each flight on this route.
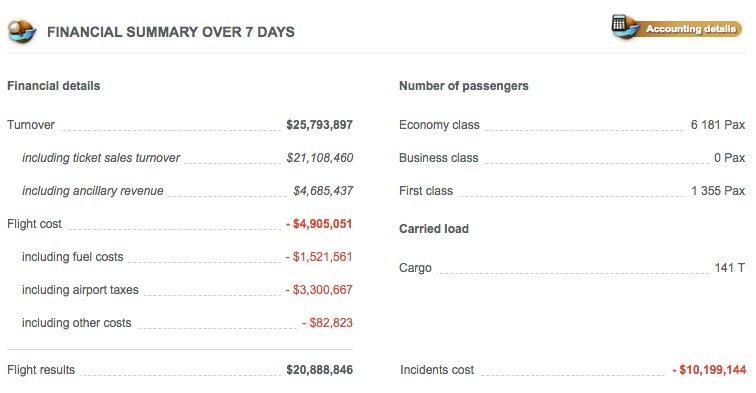
Financial summary
The fourth insert shows the detailed results of the route on a 7 days basis.
- Financial details: turnover + flights cost.
- Number of passengers: number of passengers per class.
- Carried load: number of carried tonnes for cargo.
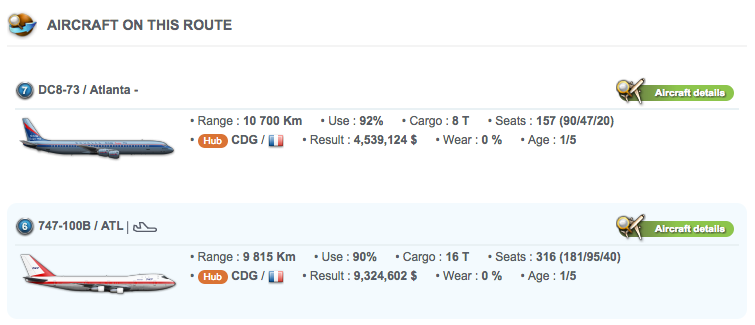
The fifth insert enables you to see the aircraft flying on this route. This list provides information you can also find in your aircraft list in the Aircraft management section.
Flight details
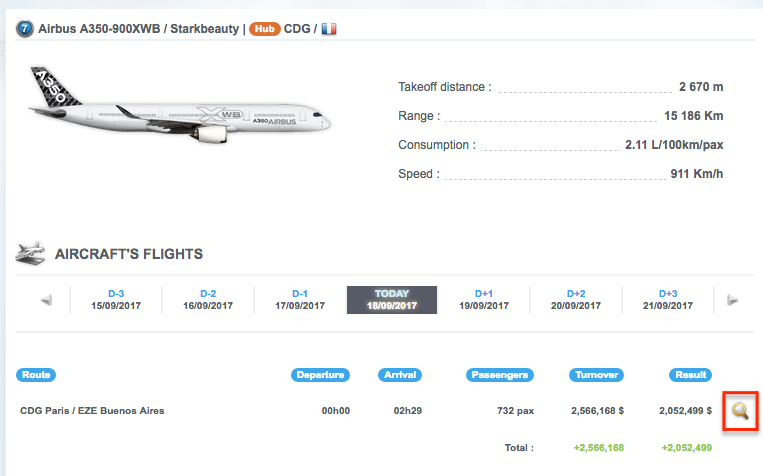
To see the flight details of a route, go to the “route details” then select an aircraft flying on the route by clicking the “aircraft details”. Once on the aircraft details page, you can see the list of flights operated by the aircraft by clicking on the “flights detail” button. Once on this page, you can click the magnifying glass to learn more about one flight.
The page named “Flight details” provides some useful information such as the exact passenger boarding and disembarking hours of departure and arrival.
The detailed information provided in the financial details are also useful for the manager that you are.
Indeed, you will find information regarding the turnover with the detailed ticket prices for each passenger class and the cargo space, if relevant, on the flight.
In the turnover details, you will find the amount of ancillary revenue if you have developed research that enable you to make more profit on each flight. You will also know how much it cost you!
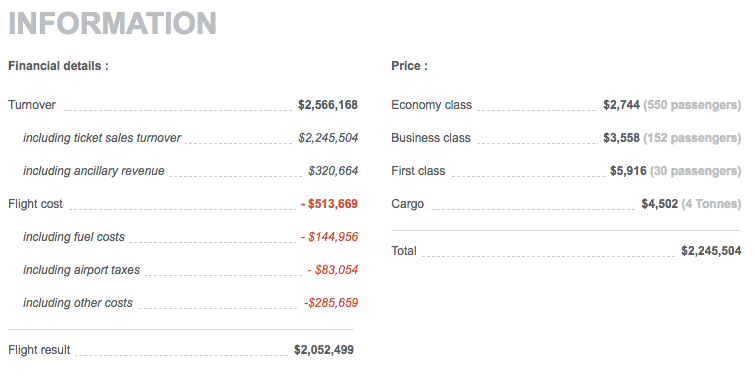
But what about the “other costs”?
They depend on the 3 following elements:
- The “expenses” characteristic of your airline. The higher it is, the higher the flight costs. It will be the case of premium airlines for example.
- The number of passengers carried during the flight. The more passengers carried, the higher the costs. However, beware of empty seats which will cost you more as an empty seat means no ticket was bought.
- A reduction of those “other costs” represents a point of equilibrium with the whole system of the Maintenance. Indeed, the cost reduction depends on the wear coefficient of the aircraft, on the flight duration and on the purchase price of the aircraft. The more important one of those element will be, the more important the reduction will be.
Example: If you have an aircraft that wears quickly with a very important purchase price and operating a long flight, the “other costs” amount will be lower.