This post is also available in:
 Français (French)
  Español (Spanish)
The “Network management” page provides a lot of information to best manage your routes and your hubs.
List of hubs
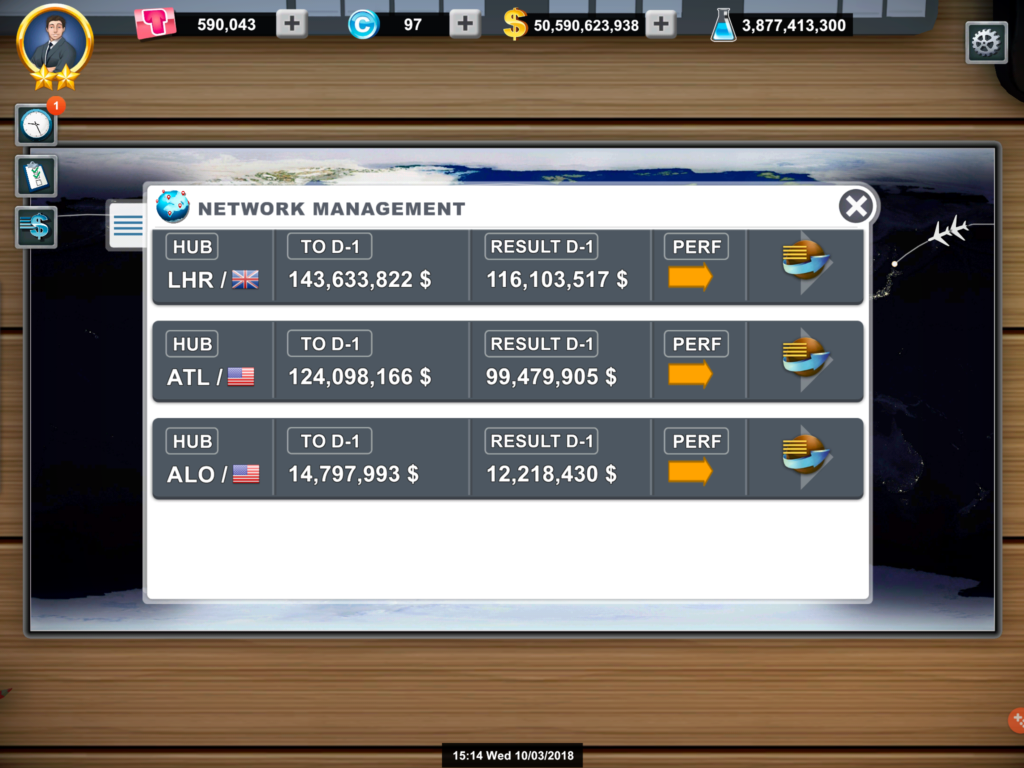
This list provides the essential information about your different hubs:
- Hub: name of the hub (if you are a beginner, you only have one hub)
- Income D-1: flights income of the day before.
- Result D-1: turnover of the day before – Flights cost of the day before (airport taxes + fuel cost + “misc.”).
- Performance: the performance index of the hub enables to know the evolution of its profits. If your profits on D-1 are better than those on D-2, the arrow is green and goes upward; if your profits remain stable, the arrow is orange and goes to the right; if your profits decrease, the arrow is red and goes downward. This index is very useful to check the evolution of your hub caused by the recent changes made by your airline.
List of routes
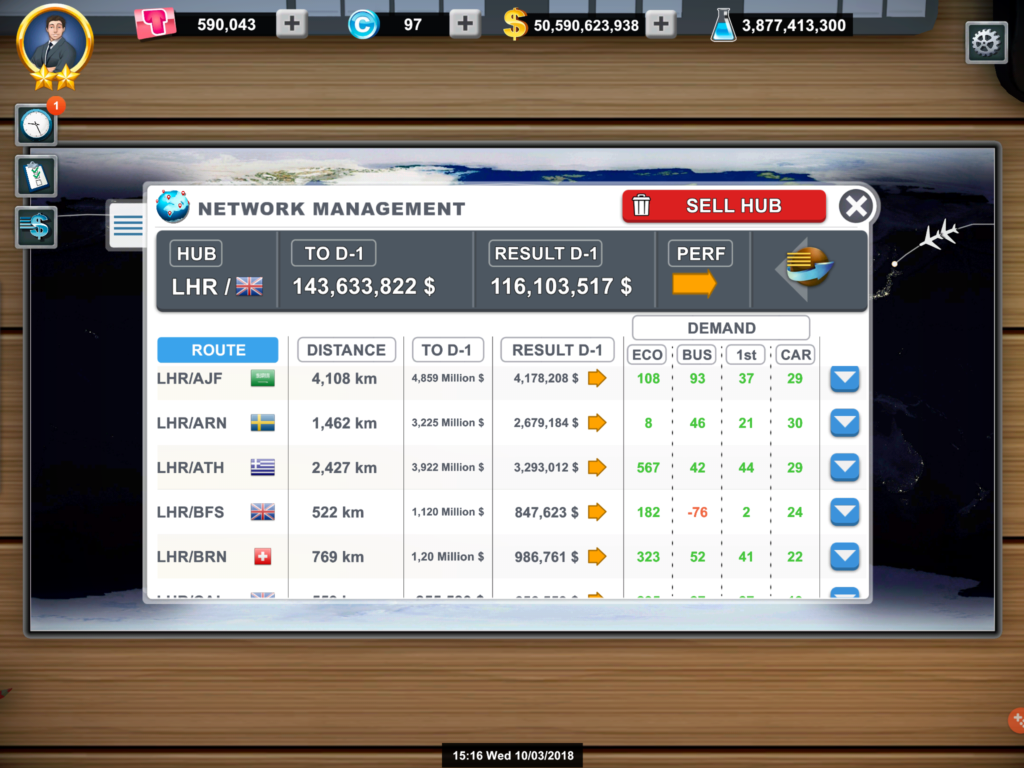
Like the hubs list, the routes list enables you to view the most important information about them:
- Route: name of the route represented by the IATA code of the departure hub and the arrival airport.
- Distance: distance of the route for a one-way flight, it is the distance to take into account before purchasing an aircraft to compare the route distance with the aircraft range.
- T/O D-1: the turnover generated on the day before by this route. This is the gross result of the route before deducting the different operating costs.
- Result D-1: the net profit generated on the day before by all the aircraft flying on this route.
- Performance: the performance index of a route enables you to view the evolution of its profits. If your profits on D-1 are better than those on D-2, the arrow is green and goes upward; if your profits remain stable, the arrow is orange and goes to the right; if your profits decrease, the arrow is red and goes downward. This index is very useful to check the evolution of your hub caused by the recent changes made by your airline.
- Demand: number of passengers who want to travel on this route with your airline and for whom you don’t offer seats in any flight. This figure is an addition of the different passenger classes. If you only want to make one passenger class travel, it is recommended to increase prices for the other classes until their demand falls to 0 and therefore facilitate the reading of the remaining offer.
- Route details: this button enables you to purchase an aircraft for this route, to schedule a flight on this route, and to change the prices of this route.